Final Exam / Assessment
(60 points)The final exam in this course serves two purposes. First, you can earn up to 60 points towards your final grade by completing this assignment. Secondly, it serves as an assessment tool to help NSU educators and the administration evaluate, measure, and document the academic readiness, learning progress, and skill acquisition of students. By completing Steps F and G below, your work will both be graded for points and will be used for assessment purposes.
- Watch the video
Final Exam
(CC).
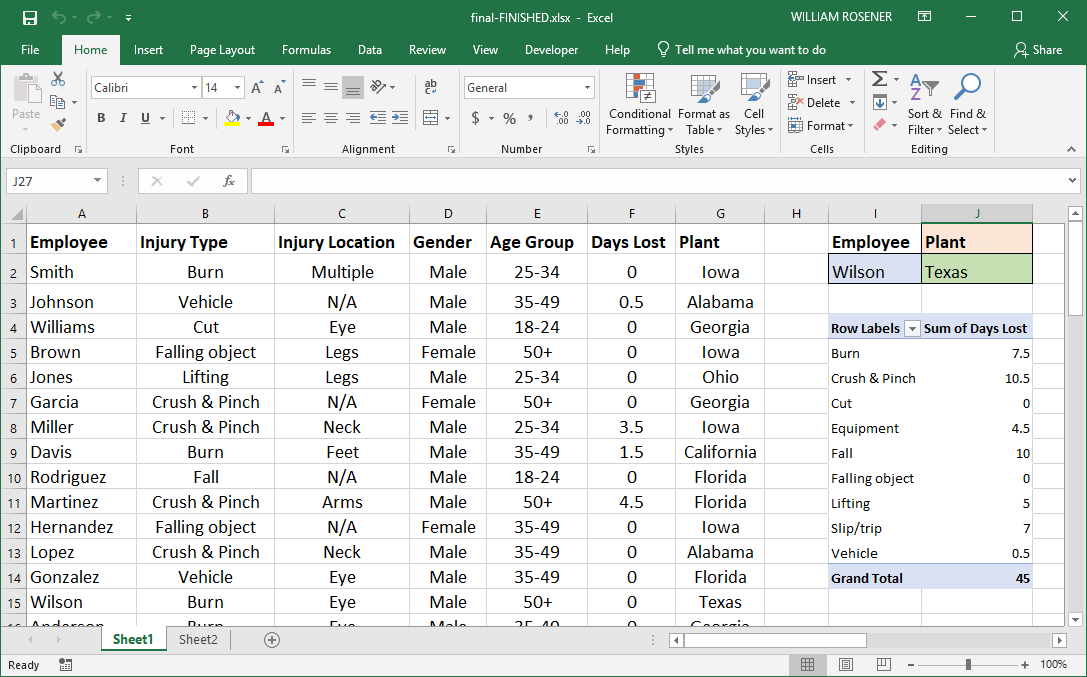
- Create a Microsoft Excel document OR a Google Sheet document similar to the document
developed in the video and shown below.
(Data: MS Excel
or HTML) . Insert your name somewhere in the document.
- Insert a two-way vLookUp function that allows the user to find information based on the employee name and (injury type, injury location, gender, age group, days lost, or plant). (See Assignment 7).
- Insert a pivot table that allows the user to view the injury types and sum of days lost. (See Assignment 8).
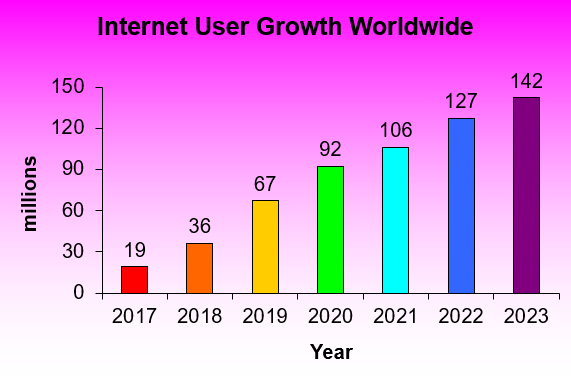
- Create a clustered column chart that meets the following requirements.
(Data: MS Excel
or HTML).
(See
Assignment 5).
- Add the titles "millions" and "Internet User Growth Worldwide"
- Change the scale on the Y axis (to increments of 30)
- Add data labels above the points
- Change the color on the points (rectangles)
- Insert a gradient fill from pink to white
- In at least 500 words compare and contrast "MS Excel" and "Google Sheets". Possible topics: pros of Excel, pros of Google Sheets, cons of Excel, cons of Google Sheets, key differences, price, sharing and collaboration, number of users (which application is used more frequently), demographics (statistical characteristics of the market share), etc. Add this information (in a separate tab) to your final exam.
- Save your work as "final-exam".
If using Google Sheets, share this document with your instructor: rosener@nsuok.edu.
- Upload this file to YOUR-CLASS-WEBSITE.
Help
- Upload this file to the NSU "Watermark Student Learning and Licensure" (assessment) software application located on Blackboard. To do this, press on "Learning Modules" / "Week 16" for this course on NSU Blackboard. Then press the hyperlink that corresponds to the course reference number (CRN) you are enrolled in (e.g., "Final Exam - CRN 21247"). There you should find an option for uploading your file.