Assignment #5

  (30 points)

  1. Watch the video Charts (MS Excel)   (CC).

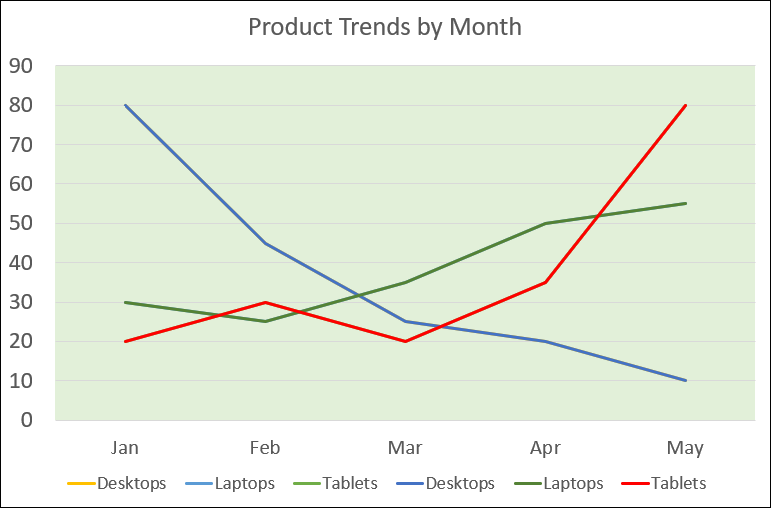
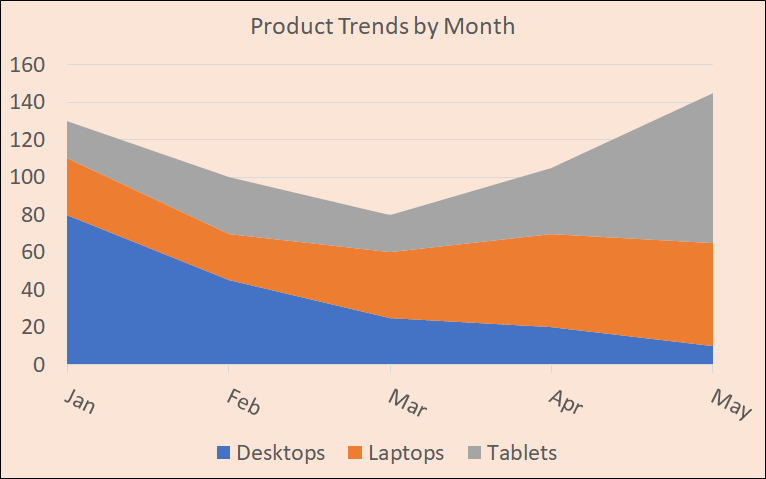
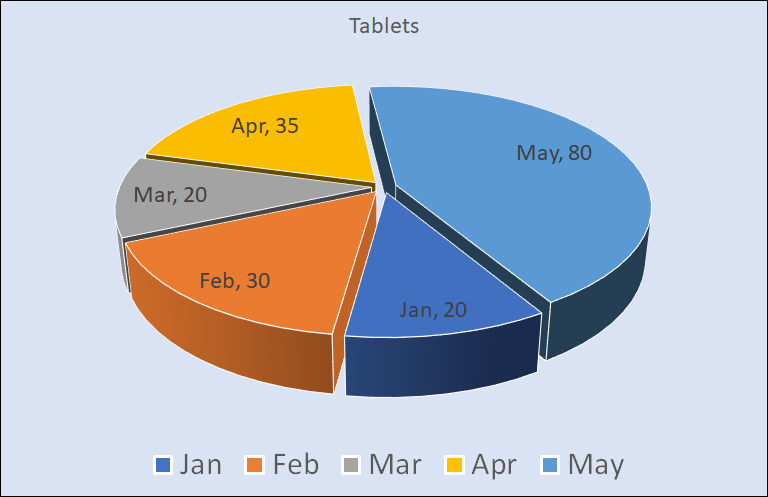
  2. Create three charts similar to those developed in the video and shown below. (Data). Insert your name somewhere in the document. Place each chart in a separate tab. Rename the tabs "Chart1", "Chart2", and "Chart3".


  3. Create a new tab in the MS Excel document created in the previous step. Rename this tab "Chart4". (Data). Insert a chart into this tab that looks similar to the image below making sure to include the following:
    • Chart title: "Product Sales".
    • Vertical Axis: "Units Sold".
    • Chart area: Gradient fill.


  4. Explore at least two of the tutorials listed at Excel Charting Tips & Tutorials. Convince the instructor that you understand the key concepts in these tutorials by including one or more of the following: a summary of the tutorial, modified formulas similar to those covered in the tutorial, details, examples, charts, tips you learned, etc. Add this information (in a separate tab) to the document created in the previous step.

  5. Save your work as "assignment5.xlsx" when you are finished.

  6. Upload this file to YOUR-CLASS-WEBSITE.   Help


Grading Rubric
Required Elements Points Possible Does not meet requirements Meets some requirements Meets or exceeds all requirements Your Score
1. Spreadsheet (Charts 1, 2 and 3) contains the required three charts similar to those developed in the video and shown above. Document uses borders and shading to enhance the visual impact. 10 0 5 10 __/10
2. Spreadsheet (Chart 4) contains the required chart similar to the image shown above. Document uses borders and shading to enhance the visual impact. 10 0 5 10 __/10
3. Convinced the instructor that you understand the key concepts covered in the tutorial(s) listed in Step #4. 10 0 5 10 __/10
Total points __/30