Assignment #15

  (10 points)

  1. Watch the video Working with Charts (Google Sheets).

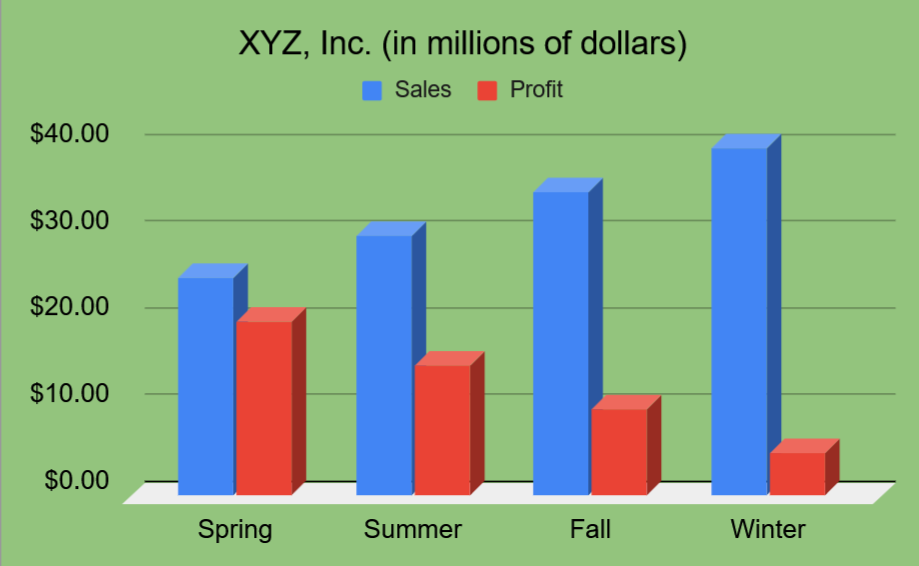
  2. Create a Microsoft Excel OR Google Sheets document (chart) similar to the document developed in the video and shown below.


  3. Insert your name somewhere in the document. If using Google Sheets, share this document with your instructor: rosener@nsuok.edu

  4. Save your work as "Assignment15".

  5. Upload your MS Excel file or embed the Google Sheets link on YOUR-CLASS-WEBSITE.   Help


Grading Rubric
Required Elements Points Possible Does not meet requirements Meets some requirements Meets or exceeds all requirements Your Score
1. Inserted data correctly. 2 0 1 2 __/2
2. Created a 3D Column Chart. 4 0 2 4 __/4
3. Formatted the chart by: adding a title and changing the background color. 4 0 2 4 __/4
Total points __/10